Introduction
It is obvious, Euler is back. Growth is vertical, bears are squeezed, and doubt ridden – but what has sustained growth over the last 6 months?
The main reason for a successful bootstrap is always a good product; but the full answer to the question remains hidden in the incentive program’s details.
Disclaimer: The views expressed in this document are mine alone and do not reflect the views of Blockworks Advisory. My Twitter: (Link)
Table Of Contents
- High-Level Overview Of Euler Incentive Program
- The Theory Behind Euler Incentive Program
- Uncovering The Facts: Euler Suffering From Success
- Exploiting Euler’s Program: Incentive Gaming On Base
Key Takeaways
- Bootstrapping Success—And Looming Diminishing Returns | The incentive program achieved its short‑term mandate: TVL compounded ~80 % MoM for five straight months on just $2.9 m of spend, pushing cumulative disbursements to ≈550 k EUL. Yet the TVL‑per‑dollar metric is rising month‑over‑month, signalling that each new incentive dollar now buys materially less liquidity. If Euler wants the program to power continued growth, they should consider scaling the program accordingly.
- Latent Demand Revealed By Redemption Behavior | Across chains, outstanding (claimed‑but‑unwithdrawn) rewards tower actual withdrawals. Low early redemptions and an aging cohort of positions imply the prevailing EUL price still sits below recipients’ opportunity‑cost threshold. Monitoring the redemption‑to‑price ratio is critical for tuning emission levels.
- Possible Incentive Exploiting On Base | Base accounts for just ~2 % of protocol TVL yet hosts ~60 % of all outstanding positions (9 k / 15 k) while receiving only ~10 % of distributed rEUL (56 k / 540 k). This numeric mismatch suggests looping or other mercenary tactics designed to farm rewards cheaply. Safeguards—such as tighter per‑address caps, chain‑specific weightings, or activity‑based claw‑backs—are needed to curb dilution and protect long‑term program integrity.
## High-Level Overview Of Euler Incentive Program
Importantly: This report only focuses on reactive campaigns and excludes all incentive matches (Link To Data)
In concert with institutions and DeFi farmers, organic demand created an avg 80% MoM increase in TVL over the last five months. When measured at realized cost, the spend of the incentive program totals $2.9m. As participation increased the distribution of EUL every month did so too. After being live for 6 months, EUL dispersed totalled around 550k; of that, 264k was allocated in the past two months.

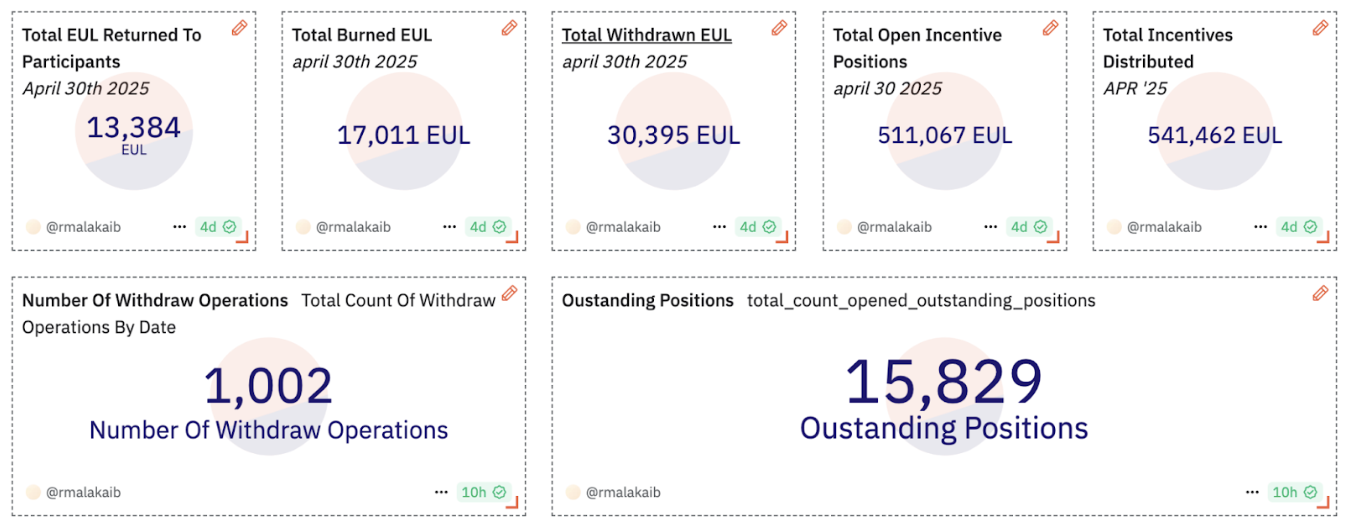
Across Ethereum, 446k EUL was allocated, of which 420k EUL was claimed – waiting to be withdrawn, and only 27k EUL was actually withdrawn. The disparity between open-outstanding claims and closed-withdrawn claims isn’t isolated to Ethereum. Base, Berachain, BNB, and Sonic all exhibit similar differences.

## The Theory Behind Euler Incentive Program
Incentive programs that utilize vest-burn, linear non‑fungible vesting stream, and redemption-upon-request functions create a relationship between the price level of EUL and redemption operations of incentives. What does this actually mean?
- If the level of redemptions is low — indicating that incentive recipients aren’t withdrawing early — then the price that Eul sits at is below the opportunity cost of capital and there is more demand for Euler incentives. In turn, there is latent demand for incentives that remains unmet at that price level.
- If the level of redemption is high — indicating incentive recipients are withdrawing early — then the price of Eul sits above the opportunity cost of capital and there is less demand for Euler incentives. In turn, there is a demand glut for incentives at that price level.
The point: It is possible that Euler’s growth was sustained in the short-term by the Euler Incentive Program. To what extent is dependent on answering: how effective has the Euler Incentive Program been at particular price and/or TVL levels?
## Uncovering The Facts: Euler Suffering From Success
Highlights: Numeric withdrawals are far lower than open positions and tend to increase when prices are higher. Outstanding Positions continue to mature. Low withdrawals, high outstanding positions, and maturing positions signal that there is latent demand for incentives. The incentive program successfully jump‑started Euler V2; opposite to traditional understanding, the strong efficiency ratio—high TVL generated per dollar spent— is a sign of reduced impact at later stages of bootstrapping. If the incentive program’s goal was only to bootstrap the protocol and achieve critical mass, the job is done. If the mandate has shifted to supporting ongoing growth, the budget/strategy must expand to satisfy unmet demand and cover the diminishing returns of incentive spend as liquidity increases.
- Withdrawn Operations Lower: Clearly, by both amount and number, outstanding positions dwarf withdrawn positions.
- Withdrawals Rise at High Prices: The average price level since the start of the campaign was $4.83 per EUL. The number of withdrawals skews right, well above the mean.

- Majority Withdrawals Are Before Day 40: but this number is likely to change because the majority of outstanding positions are above 40 days maturation.

- Outstanding Positions Are Aging Up: paired with the relatively low amount of withdrawals, the maturing of positions signal that there is still latent demand for incentives at current prices.

- Dollar Spend To TVL Ratio Declining MoM: As incentive programs become viral, a critical mass of capital is attained and network effects self-perpetuate. While positive, liquidity is a double edged sword; not every incentivized dollar’s impact on TVL is as major as previous dollars when liquidity effects are growing. Material TVL gains become marginally more expensive, and the behavioral cost of end users who receive incentives no longer justify dilution to token-holders.

## Exploiting Euler’s Program: Incentive Gaming On Base
Highlights: When compared to peers Base is a statistical outlier in number of outstanding positions versus the amount of rEUL gifted to program participants. As a result, it is practical to assume some irregular behavior and possibly the presence of looping strategies.
- High Numeric Open Positions vs. TVL: Base represents just 2% of Euler V2 TVL ($32m) but 9,000 of the 15,000 outstanding positions.

- Low Amount Of rEUL vs. High Numeric Open Positions: Of the 540k rEUL distributed Base represents just 56K. Given Base’s relatively small allocation of rEUL and its disproportionately high number of outstanding positions, it’s reasonable to infer the presence of mercenary activity.

- Base Dominates Daily Open Positions: there is a notable disparity when contrasting the amount of EUL opened each day against the number of positions opened each day.

Conclusion
Euler’s incentive program has been undeniably effective at catalyzing early growth—but sustaining that momentum will require adaptation. With redemption behavior signaling latent demand and data pointing to potential exploitation, Euler must now decide whether to scale strategically or risk diminishing returns. Another path does exist if Euler decides to maintain the same level of incentive distribution, which may indicate it would rather focus on organic growth and finding its equilibrium where supply and demand naturally rest.